// ARR growth
Annual recurring revenue
£4,739,587


>_ Ask your business anything
Connect Xero or QuickBooks and see the story behind your recurring revenue. ARR, churn, retention and more.
Questions DealSheets answers about your business:
// Integrations
Connect Xero or QuickBooks and DealSheets pulls in your invoices and customers, then calculates every metric the same way, month after month.
Data from Xero and QuickBooks flows into DealSheets, which calculates ARR, net revenue retention, churn and customer concentration.
// Meet the founder
DealSheets started inside SAS. We kept seeing the same thing: great businesses walking into investor conversations without numbers they could stand behind.
“Every recurring revenue business has a story in its numbers. We built DealSheets so you can read it before an investor does.”
What is DealSheets? Video
// The problem
01 · Scattered
Xero, QuickBooks, CRM exports and a folder of spreadsheets, each telling a slightly different story. Ask for ARR and you get three answers.
02 · Connected
Connect your accounting system once. Every invoice is classified and every metric is calculated the same way, month after month.
03 · Clear
Not just what your ARR is, but why: new customers, upsell, churn and the customers you depend on most.
Illustration: scattered spreadsheet cells, mismatched totals and #REF! errors reorganise into a clean DealSheets dashboard showing ARR, retention, churn and customer concentration.
// What DealSheets reveals
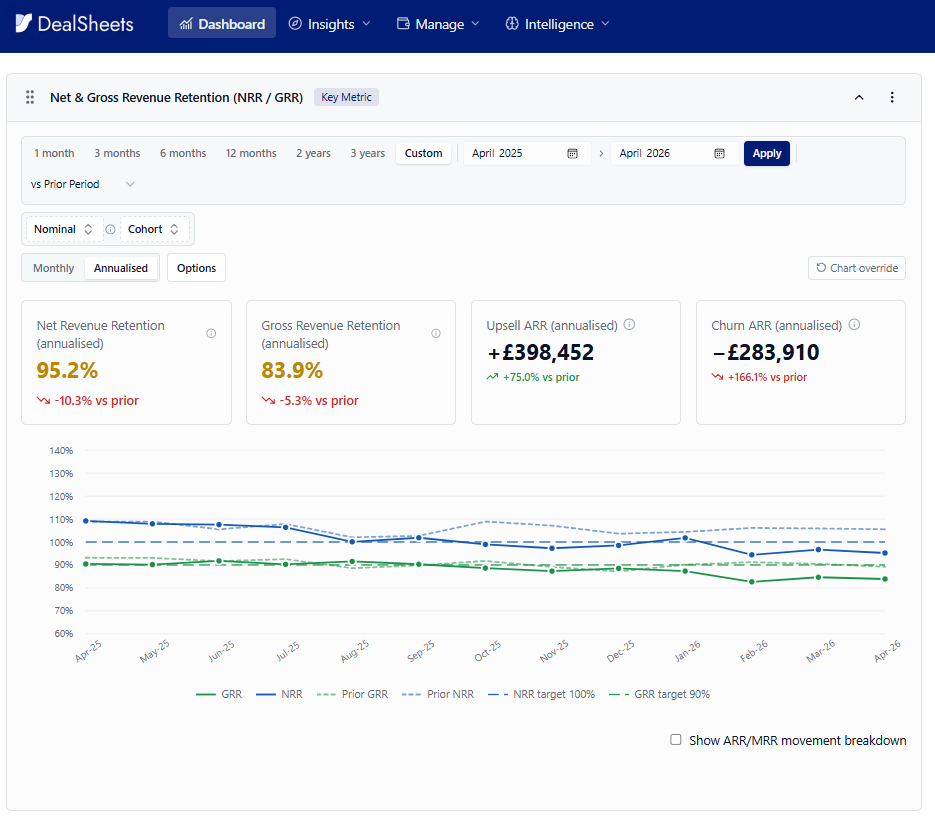
The metrics investors ask about first, calculated from your own ledger, every month.
// ARR growth
£4,739,587
// Revenue quality
// Churn rate
1.6%
// Expansion
// Net retention
// Revenue mix
// Customer growth
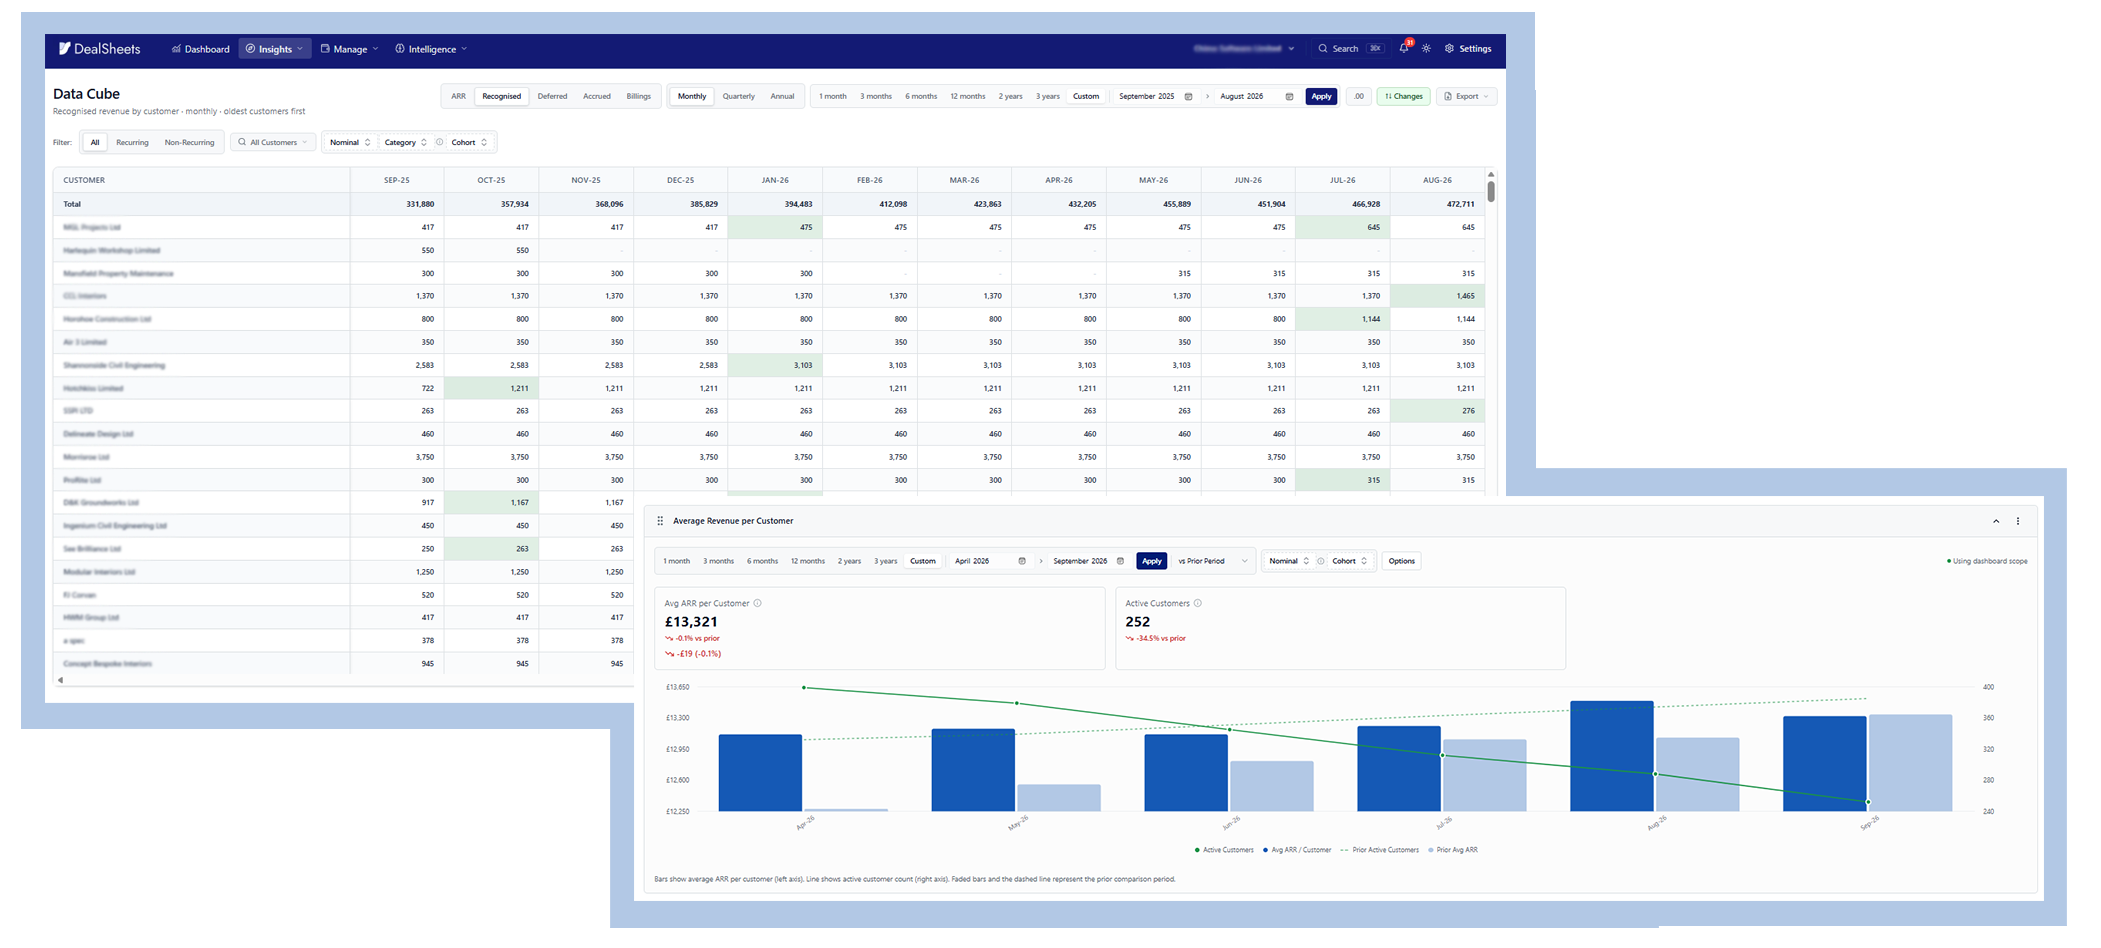
252
// Unit economics
£13,321
// Two lenses, one dataset
Founders watch revenue and customers. Investors look at the quality of that revenue, the risks behind it and what it's worth. Same numbers, different story.
Revenue · 12 months
£5,210,000
▲ 41% on last year
Customers
252
+38 in 12 months
Revenue growth
41.0%
Year on year
Biggest customer
£45,000
Harbour Labs · 0.9% of revenue
New customers · 12 months
38
▲ 12 more than last year
Average monthly revenue
/100 £434,167
Last 12 months
✓ Strengths to leverage
! Red flags to investigate
↗ Growth opportunities
// Who it's for
Know what your business is worth and what's driving it, so you walk into investor or buyer conversations with numbers you can defend.
Stop rebuilding the ARR spreadsheet every month. Get consistent metrics straight from Xero or QuickBooks, ready for the board pack.
See the quality of recurring revenue across a portfolio or an acquisition target, calculated the same way every time.
Offer clients investor-grade reporting as an advisory service, built by accountants who understand recurring revenue.
// Proof
DealSheets gave us one consistent ARR figure across the whole portfolio, and it was significantly higher than we expected. It's given us real confidence in our growth story.
32%
higher ARR than the figure in their own spreadsheets
Trusted by accountancy firms, private equity and consultancies
 Xero
Xero QuickBooks
Built by SAS
QuickBooks
Built by SAS// Book a demo
What you'll get from your demo:
Built by SAS, ICAEW-registered accountants
> demo_booked ✓
Thanks there, we'll be in touch within one working day to arrange your demo.
Prefer to talk? Call 0333 202 6441 or email hello@dealsheets.co